
Copper’s Two-Layer Rally
Two forces are moving the copper price. The tariff trade reverses on policy. The structural demand shift from AI and grid buildout runs on a decade-long timeline.
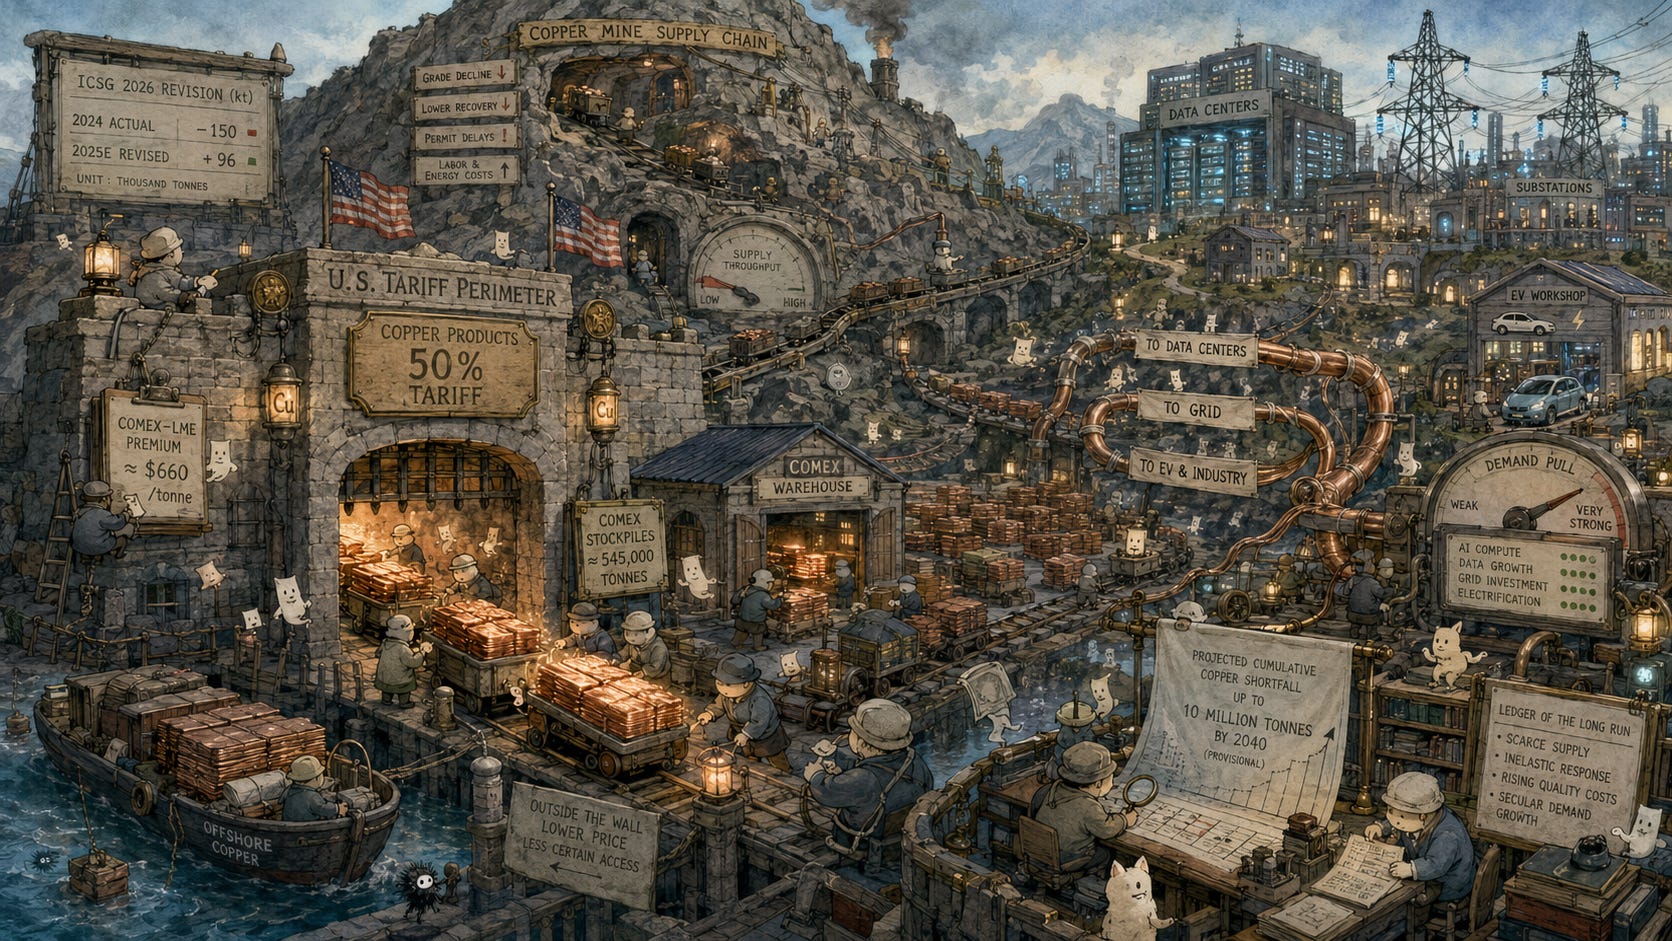
COMEX copper closed at $6.24/lb on May 8, up 35.5% from a year ago. COMEX and the London Metal Exchange (LME), which sets the global copper price, are quoting at a premium to each other. LME cash sat at roughly $5.94/lb ($13,100/tonne) in the same week. That roughly $0.30/lb ($660/tonne) gap between the two markets exists because traders are paying a premium to get copper inside the US before import tariffs drive the cost up.
The rally has two separate drivers. The near-term move is a tariff trade: traders rushing to stock US warehouses ahead of a 50% import tax on copper products. The structural move underneath it is AI data centers, power grid expansion, and electric vehicle production pulling demand into a mining pipeline that operates on decade-long timelines. The tariff trade reverses when US stockpiles draw down or policy changes. The AI and grid demand is backed by multi-year spending commitments and moves on a different trigger.
The COMEX premium
The roughly $660/tonne premium COMEX holds over LME is the tariff trade made visible.
The US applied a 50% import tariff to copper products, including wire, rod, pipe, tube, and connectors, in April 2026, applying it to the full import price. Traders responded by loading as much metal as possible into US warehouses before the window tightened. COMEX stockpiles reached roughly 545,000 tonnes in late April. Futures prices rose to match the premium being paid to deliver copper inside the US tariff perimeter.
Two policy decisions control the spread from here. If the tariff extends to raw copper inputs, specifically cathode and anode (currently excluded), US supply tightens and the premium grows. If US stockpiles draw down without being replenished, the premium shrinks as the trade unwinds. LME cash at roughly $13,100/tonne is already above JPMorgan’s $12,500/tonne Q2 target, so the London price is not waiting for a bullish price target to validate the move. The risk is now different: Goldman Sachs, which holds the most bearish consensus view, forecasts LME declining to $10,000-$11,000/tonne through 2026 if the near-term trade fades. The COMEX level above LME is the cost of landing copper inside the tariff wall.
AI, grid, and the mine gap
China uses 58–60% of the world’s refined copper. Grid expansion, EV production, and AI data centers are the main demand drivers today, having replaced the property market that led prior cycles. Government-backed groups in China have reportedly pushed for strategic copper reserves. Chinese buyers have been described as purchasing on every price dip.
AI data centers are a new copper demand source that supply planners were not modeling three years ago. A 1 GW data center requires roughly 65,800 tonnes of copper. Global data center copper use was 467,000 tonnes in 2023; Fastmarkets projects 710,000 tonnes by 2026, plus another 624,000 tonnes for the grid infrastructure that powers those facilities. If US data center electricity demand grows from roughly 5% to 14% of total US consumption by 2030, as currently projected, every added gigawatt needs copper both in the building and in the transmission network delivering the power.
New mine permits take a decade or more to work through. Grasberg, one of the world’s largest copper mines, suffered a major production disruption and is running at roughly 500,000 tonnes this year against an original 730,000 tonne plan. Kamoa-Kakula, one of the largest new mines in Africa, cut its 2026 production target to 290,000–330,000 tonnes in March, down from 380,000–420,000 tonnes just three months earlier. S&P Global projects a cumulative copper supply shortfall of up to 10 million tonnes by 2040.
Michael Hartnett at BofA put it directly: “whoever controls chips, rare earths, minerals, oil, wins the AI war.” The companies spending hundreds of billions on AI infrastructure are creating copper demand faster than the mining industry can respond. That gap is the structural copper thesis.
Of the four metals I cover here, copper is the last awaiting a full structural repricing. Gold has moved from roughly $1,800 to above $4,700 on sustained central bank buying. Silver is six years into a physical deficit. Copper is already trading at multi-year highs, but the current LME price still owes more to the near-term tariff and inventory trade than to a full pricing of the projected 10 million tonne supply shortfall by 2040. I think the next stage arrives when the tariff arbitrage clears and the market is left confronting the mine gap directly.
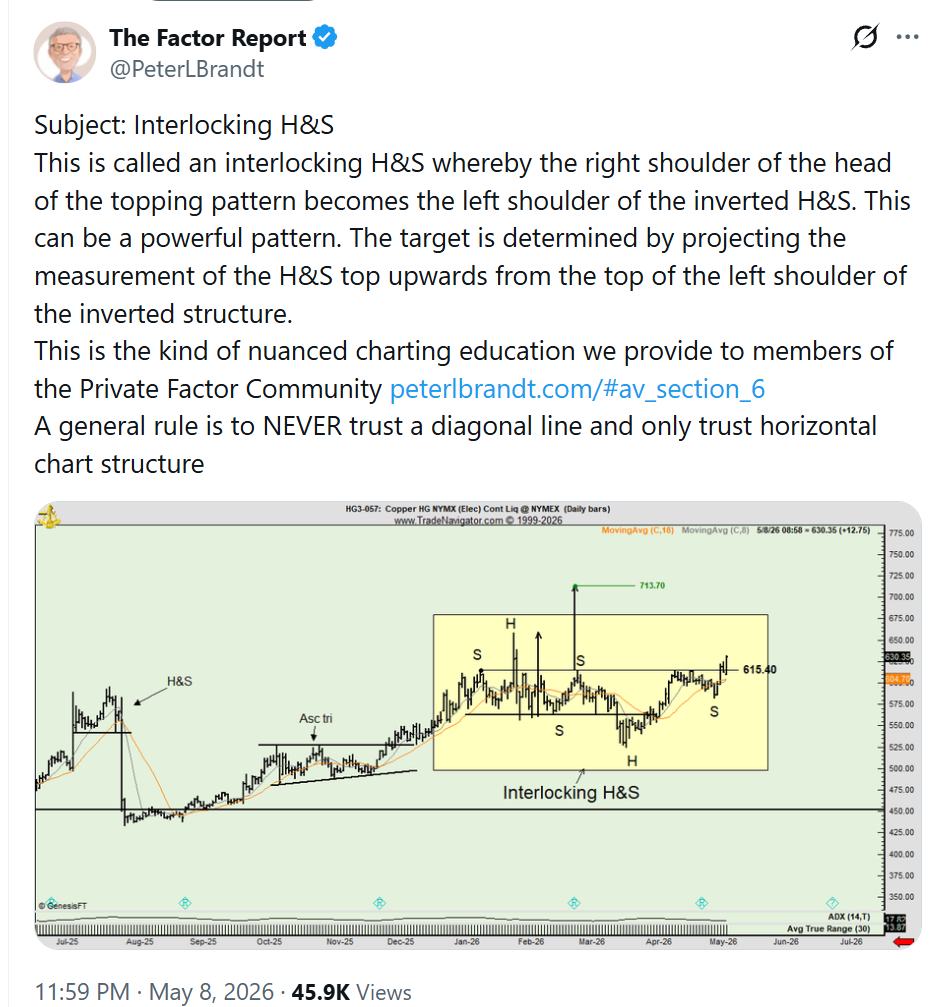
Even Peter Brandt is saying copper is transitioning into an interlocking H&S, and should be bullish.
The 2026 balance revision
The International Copper Study Group (ICSG), the main body that tracks global copper supply and demand, revised its 2026 market forecast in April. It now expects a 96,000 tonne surplus for 2026, flipped from a 150,000 tonne deficit it was projecting last October. That is a 246,000 tonne swing, driven by lower demand growth estimates and higher recycled copper output.
The structural supply gap opens in the 2027–2030 window. In the near term, the surplus means 2026 prices can hold on supply clearing the market at current levels. The ICSG also cut 2026 mine production growth to 1.6% from 2.3%, and the Grasberg and Kamoa disruptions are confirmed. The surplus is coming from revised demand estimates rather than new supply coming online, so it can shrink quickly if demand picks up.
I would stay constructive on copper through 2026. The trade requires inventory confirmation. Watch the COMEX-LME spread and LME warehouse stockpiles together. A narrowing spread with stockpiles drawing is the clean outcome: the tariff premium shrinks while structural demand absorbs the available supply. A narrowing spread with stockpiles still building means the 2026 price thesis needs more evidence before sizing up.
Gold: reserve demand, visible risk
Central bank buying and investment demand are carrying gold at $4,715/oz.
The World Gold Council’s Q1 2026 report shows total gold demand at 1,231 tonnes, up 2% from a year earlier, with a record quarterly market value of US$193bn. Central banks bought 244 tonnes net, up 3% year on year. Gold ETFs added 62 tonnes globally. The average gold price for the quarter was US$4,873/oz.
US gold ETF demand reversed in late Q1, and jewelry buying fell under record prices. Those two reversals mark the risk boundary. Central bank accumulation is the load-bearing demand. The price holds as long as reserve managers are adding gold faster than ETF investors are selling. A sustained rise in real yields (government bond returns after inflation), a US dollar index recovery above 105, or a drop in central bank buying back toward the pre-2022 annual norm of 473 tonnes would narrow that margin quickly.
I would buy gold on weakness when macro stress or reserve diversification is live. The risk/reward at current levels is tighter than it was six months ago when spot was roughly $400/oz cheaper.
Silver: sixth deficit, thinning fabrication
Solar panel makers are using less silver per panel, and that is cutting into the industrial demand story at the same time the physical market is running short.
The Silver Institute’s 2026 World Silver Survey projects a deficit of 46.3 million ounces, the sixth straight year the market uses more silver than it produces, after five years of drawing down above-ground stockpiles. Physical tightness in London’s silver market and rising silver lending costs in late 2025 confirmed the deficit as market-visible. The February preview had estimated a 67 million ounce deficit; the confirmed number is smaller because industrial demand destruction has already closed part of the gap.
Silver’s upside depends on investment demand and physical tightness holding while industrial volumes soften. Position it as high-volatility precious metal exposure with squeeze potential, sized for the swings.
Nickel: surplus intact, squeeze watch
Nickel enters May 2026 with a projected 261,000 tonne surplus for the year, following a 209,000 tonne surplus in 2025. The structural picture is unchanged.
The International Energy Agency’s 2025 critical minerals report projects that nickel supply catches up with demand if planned Indonesian projects proceed as expected. The top three nickel-producing countries are on track to supply 85% of the global market by 2035, with Indonesia driving most of that growth. LME warehouse stocks have been rising for two years.
LME nickel briefly touched $20,000/tonne on May 6, the first trading day after the holiday week, with warehouse stocks falling by 1,002 tonnes over the same period. That is a positioning squeeze. The picture changes only if Indonesia restricts its own supply, official market forecasts revise toward a deficit, or warehouse stocks fall for four straight weeks alongside a confirmed policy change.
Iron ore: no view
Iron ore is the world’s most-traded dry bulk commodity, and I do not carry a view on it here. The market runs on Chinese steel production and the property sector, a different demand structure from the copper, gold, and silver cases above. Structural oversupply from Australian and Brazilian producers has been a price headwind for years.
Position by metal
Copper has the most active near-term catalyst and the most durable structural demand case. I hold a core copper position and add when LME warehouse stocks draw for two or more consecutive weeks, which is the signal that structural demand is absorbing available supply at current prices. The ICSG surplus revision constrains how far the 2026 price can run. The thesis softens if the surplus keeps building through Q2 while demand growth slows below the 1.6% ICSG revised forecast.
Gold is a durable hold when macro stress or reserve diversification is live. Add on price weakness; reduce if ETF outflows persist alongside rising real yields. At 244 tonnes of net central bank buying per quarter, the next leg higher requires that pace to accelerate or investment demand to broaden beyond central banks.
Silver is tactical. Size it for the squeeze: the add trigger is physical tightness and silver lending stress, not price momentum that follows gold. The ceiling is lower than it was two years ago.
Nickel is a watch. The short-term squeeze signal is live as of early May. A structural long requires Indonesian supply restraint or a material revision to the surplus forecast, and neither is confirmed.
Sources: Fastmarkets, S&P Global, Goldman Sachs, JPMorgan Global Research, ICSG April 2026, World Gold Council Gold Demand Trends Q1 2026, Silver Institute World Silver Survey 2026, IEA Global Critical Minerals Outlook 2025, BofA/Hartnett public summaries, SMM.
Analyst estimates, price targets, and scenario readings are the author’s own derivations and are not company guidance or official forecasts. This note is for information purposes and does not constitute a recommendation to buy or sell any security, commodity, or financial instrument.